Photo by Michael Coghlan on Flickr
AEMO's recent report into the major disturbance on the National Energy Market in August 2018 used Solar Analytics data to understand the response of rooftop PV. The analysis of Solar Analytics data showed that rooftop solar assisted in resolving the issue by reducing generation as required in at least two states, and has provided learnings for the industry for future incidents.
Our Head of Algorithms, Dr Jonathon Dore, breaks down what happened with the NEM islanding event and how Solar Analytics data contributed to understanding the ramifications, in a short and easy-to-understand article below.
by Dr Jonathon Dore, Head of Algorithms at Solar Analytics
Every day more people discover the value of visibility of their solar PV system through Solar Analytics. With over 25,000 systems under monitoring, we’re helping customers manage and improve the health of their systems in this rapidly growing part of the energy industry.
And now we’re helping to improve the health of the biggest system of them all – the National Energy Market (NEM).
The NEM runs on electricity networks connecting Queensland, New South Wales, Victoria, South Australia and Tasmania. Balancing the electricity supply and demand across the market is vitally important to keep our power system safe and reliable; this is the job of the Australian Energy Market Operator (AEMO).
But with 1.95 million rooftop PV systems and counting, this job is becoming increasingly difficult for AEMO as they don’t have visibility or control over these systems like they do with conventional large-scale systems. It’s especially difficult when something goes wrong, because rooftop PV systems aren’t properly represented in the NEM models. It’s like trying to coach a quidditch team with two of your players wearing an invisibility cloak. It’s made it impossible to properly predict behaviour when things go pear-shaped.
Until now.
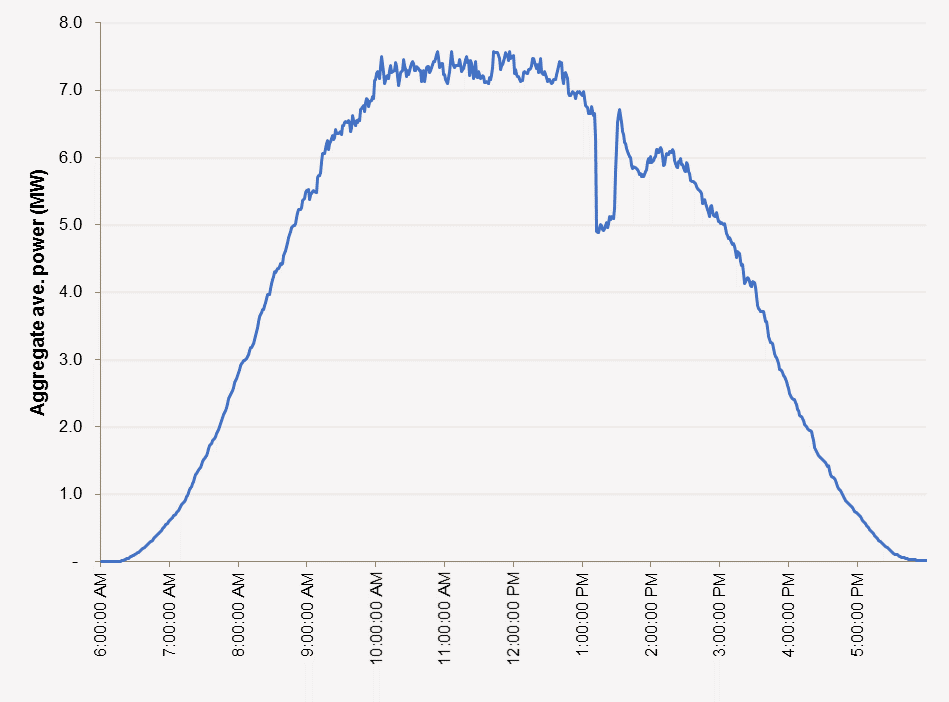
On August 25, 2018, the NEM literally fell apart. Lightning struck the tower that supports the interconnector between New South Wales and Queensland, separating Queensland from the rest of the NEM. This sent everything into such a tizz, that South Australia abandoned ship - its interconnector with Victoria tripping off due to the unusual conditions. We suddenly had three separate grids in the NEM: Queensland, South Australia, and the remaining NEM states New South Wales, Victoria and Tasmania. Queensland and South Australia were left with too much generation, sending their now separate grid frequencies high, while the rest had too little, sending the frequency down and resulting in load-shedding.
AEMO has just released an extensive report into this event, which it’s required to do when a significant incident occurs. It’s a fascinating read if, like us, you’re a massive energy geek, and highlights the need for better frequency control resources, markets and models.
For the first time, this report also includes detailed analysis of the response of rooftop PV, which was made possible through UNSW analysis of Solar Analytics monitoring data. The analysis, by PhD student Naomi Stringer, was part of a Solar Analytics – UNSW collaboration through the CRC for Low Carbon Living [1] and a UNSW – AEMO collaboration funded by ARENA [2]. It used PV production and grid voltage data from across the NEM region, anonymised so that individual systems could not be identified. It showed PV systems tripping off or dropping their output in response to the grid disturbance and gave some insights into how closely the PV systems were following the relevant Australian Standards in these scenarios, which most of them did as expected. See Naomi’s excellent summary for all the details.

The AEMO report recommends review and improvement of the standards for PV inverters so that they can better support the system after such events and also recommends getting more data and analysis of rooftop PV performance.
With Australia’s largest and highest quality resource of distributed energy data, we look forward to continuing to support this process. The good news is that every site that installs Solar Analytics helps to increase data visibility, without revealing any personal data. This will allow AEMO to continue to improve its simulation models and make informed recommendations on inverter standards so that responses to events like this have the best chance of re-stabilising the system and avoiding widespread blackouts.
It’s another way Solar Analytics is helping people to navigate the changing energy landscape, whether you’re managing your energy bills, or managing one of the most challenging electricity markets in the world!
Footnotes:
1. project RP1036U1
2. Addressing Barriers to Efficient Renewable Integration https://arena.gov.au/projects/addressing-barriers-efficient-renewable-integration/
Dr Jonathon Dore swapped International-level trampolining for data science. Lucky for us! Jono is now our Head of Data Strategy and is responsible for the sophisticated algorithms that we use to make our monitoring system the most intelligent available.
