
So you’ve set your timers on all your pumps, heating, cooling and appliances to run during daylight hours so that you can use your valuable solar energy. But do you know exactly what your solar profile is - when your solar ramps up, when it peaks, and when it tapers off? If not, you could be drawing from the grid inadvertently. Let’s take a closer look at solar profiles.
Your solar profile is personal to your solar system set-up. It’s highly dependent on your panel tilt and orientation, your geographic position, the weather on that particular day, and the season.
If you can see the sun in the sky, it doesn’t necessarily mean that you are producing peak solar at that moment. Let's look at two examples that show how different the solar production is for these two customers in September and March, and what that could mean for their electricity bills.
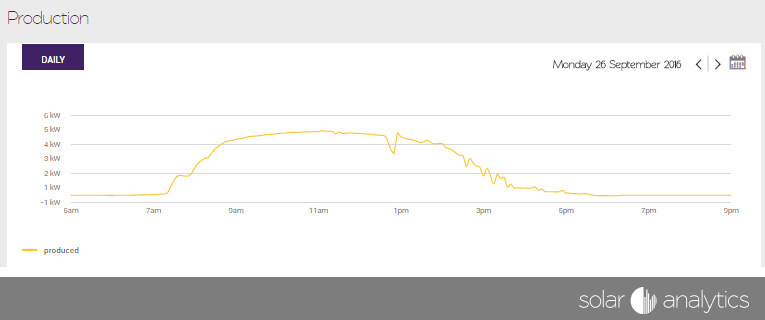
Here’s an example of a Solar Analytics Monitoring customer in Mount Victoria, NSW with a 4kW system. You can see that in late September their solar curve starts to ramp up from 7:25am, reaches 4kW at 9:15am, peaks at 11:05am and then ramps down from 4kW at 1:00pm. That’s around 3 hours and 45 minutes at their peak solar production.
Compare September to March, when the curve starts to ramp up from 8:30am, reaches 4kW at 11:05am, peaks at 12:35pm, and then ramps down from 4kW at 1:20pm. That’s 2 hours and 15 minutes of peak solar production, starting to produce solar an hour later in the morning, compared to September:

And here’s where we see the importance of understanding your solar profile. Our Mount Victoria, customer has a block of energy usage fairly regularly in the morning. You can see their energy usage (purple consumption), overlaid on top of their solar profile. The block of energy usage from 7:20-9:40am starts before their solar production peaks. You can see in the graph below that they are drawing from the grid from 7:20am until 8:25am, maybe without knowing.
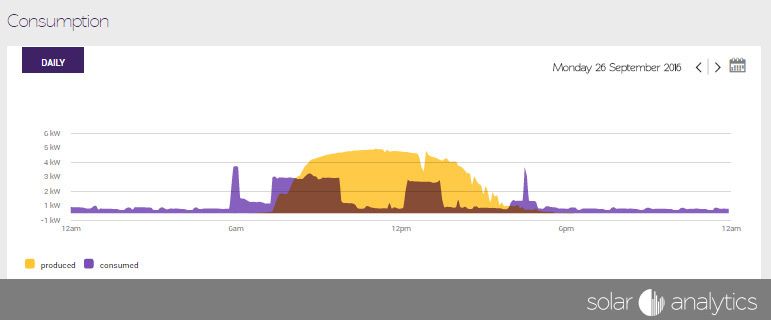
Just by shifting their large morning electricity usage to start at 8:25am (or setting a timer), they would be using only their own solar energy and not drawing from the grid at all. In March they would shift that usage to start at 9:25am. Depending on their tariffs and weather conditions, this could be worth well over $100 per year in savings.
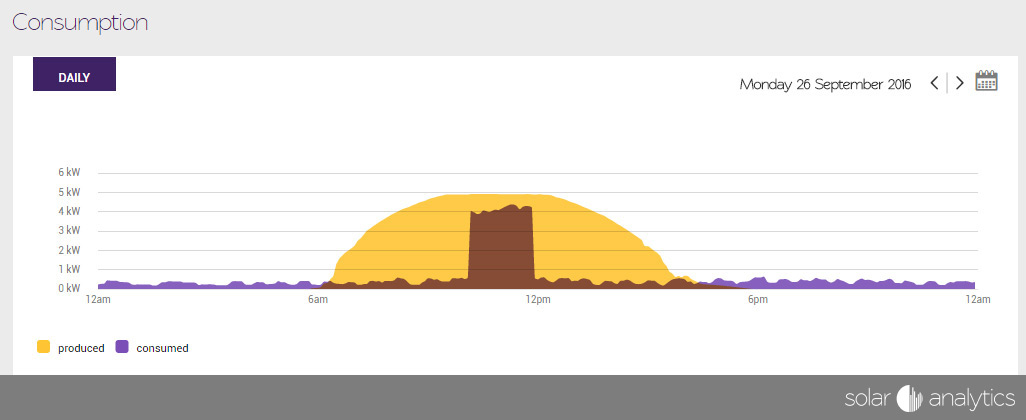
Now, contrast our Mount Victoria's customer’s solar profile with another customer from Marcoola in QLD, with a 5kW system. See their solar profile below for late September. You can see from this curve that their solar production starts to ramp up much earlier at 6am, reaches close to 5kW at 9:20am, and then drops off from 12:30pm with a quite sharp drop from 3:30pm, and almost no production from 5:00pm. They produce just over 3 hours at close to 5kW production:

Their solar system also produces less in March than in September. They see a slightly longer solar production window, from 6am to 5:30pm, but a much shorter length of time at their peak of 5kW.

It's clear that our Marcoola customer is aware of their solar profile They have managed to shift all their significant energy usage to consume their own solar production, and it is a beautiful thing to behold, both in September...:
... and also in March:
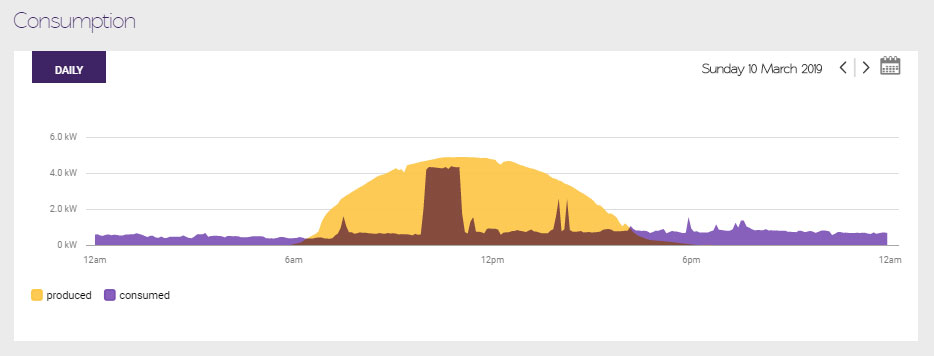
This is where you start to see some serious savings on electricity, reduced C02, and much less reliance on the grid. Knowledge is power: check your solar profile regularly to understand when you are producing your solar, and move your energy usage, where possible, to use your own solar.
Note: We acknowledge that some of our customers may still be on a very high solar feed-in-tariff, and would prefer to export as much of their solar energy as possible and pay for cheaper electricity from the grid at other times. It may be even more pertinent for those solar owners to understand exactly when they are producing solar. Check your bill or with your energy retailer to understand how much you receive for your solar feed-in-tariff, and how much you are paying for grid electricity at other times of the day.
If you would like to understand what your own solar profile is, get Solar Analytics Monitoring from one of our partners (ask us how).
