
This site in Goonengerry on the NSW north coast was recently set up by Light Touch Solar and Electrical with Solar Analytics monitoring. As a rural site, they have an export restriction of only 1kW allowed back to the grid.
With their Solar Analytics Dashboard, they can now see their usage and their exports clearly on their Dashboard. The energy usage (consumption) is purple, and looks brown where it overlaps with the solar production.
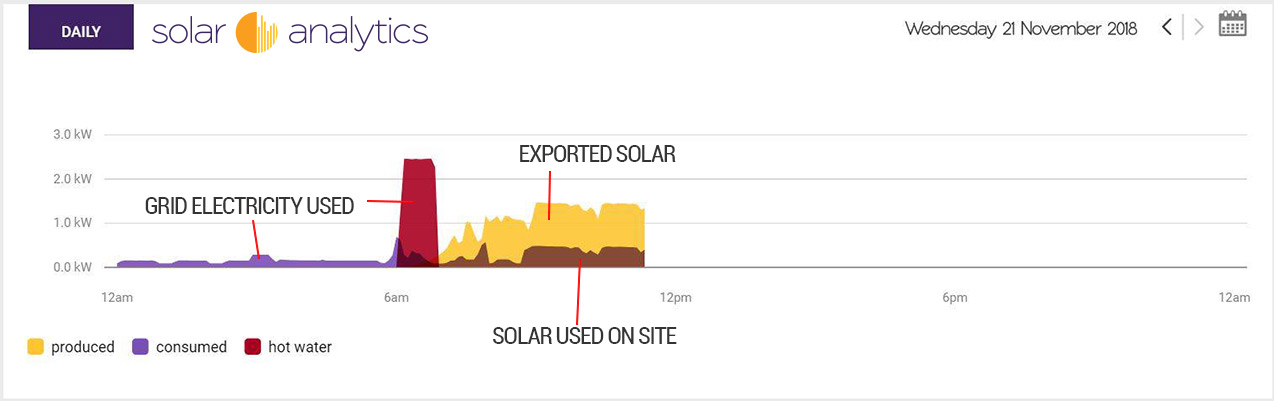
The yellow area is the solar being exported to the grid. You can see that the inverter limits the export to exactly 1kW more than they are consuming onsite. And when you look at the produced vs expected graph you can see how much solar is being dissipated (lost)! So cool!
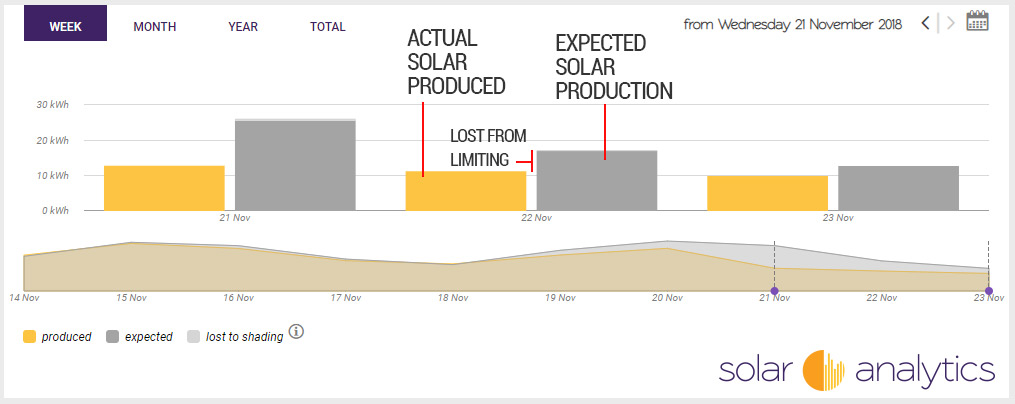
In fact, the Solar Analytics Dashboard is the only way that you can see how much solar is not being utilised from exporting limiting.
Note that with export limited sites, the 'performance' monitoring will show underperformance on days when consumption is less than the solar produced, and export is limited. However, on days where consumption is more than solar produced, you are still able to see reliable solar system performance levels.
See our blog post about solar export limiting to learn more about how Solar Analytics monitoring is useful for export limited sites.
