
How to Read Sungrow Solar Inverters: A Step-by-Step Guide
On this page:
Understanding Your Sungrow Solar Inverter
Sungrow are one of the world's leading solar inverter manufacturers, with 77GW of solar inverters shipped in 2022 (enough to power Australia). Providing an extensive range of residential and commercial solar inverters and storage products, their high reliability and build quality has made them the most popular solar inverter sold in Australia in 2023.
If you have a rooftop solar system with a Sungrow inverter, or are thinking of buying one, this article will explain how to get the most out of your Sungrow solar system. If you are considering buying a solar system, read this article for independent advice.
Solar Analytics and Sungrow have integrated to provide an enhanced experience and increased savings for solar owners. Sungrow’s iSolarCloud app provides a good basic level of solar monitoring, however by adding on Solar Analytics you will increase your solar savings (see benefits below).
Why you Want a Consumption Meter with a Sungrow Inverter
Sungrow inverters all have WiFi connection to show you your solar energy generation. You can also get an additional consumption meter so you can also see your energy usage - to see why consumption monitoring is important, read this article. In summary, consumption monitoring will measure how much electricity you are consuming, which allows you maximise your savings by choosing the best retail electricity plan, shifting your big energy loads, and determining when it makes financial sense to add a battery or other smart energy appliance. Find out more about how it works here.
If you have a Sungrow inverter, you can see your consumption meter by logging into iSolarCloud. If you can see your energy consumption and your solar energy produced, then you have a consumption meter. If you can't see your energy consumption data, don’t worry, most people can now get this through Solar Analytics courtesy of Consumer Data Rights (CDR) and open energy. Once authorised by you, the Australian government now compels your energy retailer to share your energy data with authorised third parties through. Solar Analytics is the first company to be authorised under open energy CDR, which means you can getall of the extra savings and benefits even if you don't have a consumption meter.
Having a Sungrow consumption meter installed is required for any of the following situations:
- You have a solar battery
- You have a static export limit imposed by your local electricity network (also called a DNSP), eg 5kW maximum export is common for single phase homes
- You have a flexible export, eg in Sth Australia this is required for many new solar systems. Typically this allows you to export up to 10kW of solar most of the time, but you will occasionally have your solar exports restricted by the DNSP to match available capacity on the network
Getting Your Sungrow Inverter Setup and Online
Once your Sungrow inverter has been installed and powered up, your solar installer will connect your Sungrow inverter to your home WiFi network. You can then download the Sungrow iSolarCloud app, and start monitoring your solar.
Simplifying the Sungrow Inverter WiFi Connection Process and Boosting Solar Savings
If your Sungrow inverter is not yet connected to your WiFi, follow these steps. If your WiFi does not extend to reach your Sungrow inverter, you will need to add a WiFi extender.
Once you are connected, we suggest signing up for a 30 day free trial with Solar Analytics to increase your solar savings. You can find the instructions here.
Solar Analytics saves you on average an extra $400 every year and maximises your savings by:
- True Performance - make sure your solar is performing at 100%
- Plan Optimiser - takes the guesswork out of finding the right solar energy plan
- Battery Calculator - know when it's the right time to invest in a battery and which size
- Energy Insights - shift your electricity usage and make the most of your solar
- Open Energy - consumption data from CDR (if you don't have a consumption meter)
Accessing Key Information on Your Inverter Screen
You can also see some basic information directly on the LCD screen on the front of your Sungrow inverter.
A typical Sungrow inverter will have an LCD display panel on the front similar to the below.


This screen will show you how much power is being generated right now, and the status of the inverter. This may also cycle through a number of other basic operating parameters like grid voltage, frequency and total energy. Checking this display on a daily or weekly basis is a simple way to check your solar system is still operating. To know if your solar system is working at its full potential, you can go to your Solar Analytics dashboard which will show you exactly how well your system is working after taking into account local weather and your system specifications.

More detailed information on using your Sungrow inverter can be found in your user manual which can be downloaded here.
Maximising Solar Efficiency with Sungrow and Solar Analytics
Unlocking the full potential of your solar system is a straightforward process with iSolarCloud and Solar Analytics at your disposal. As you gain access to these invaluable tools, you're poised to take control of your solar energy journey. In the following sections, we'll walk you through the home screens of both applications, providing a comprehensive understanding of how to interpret real-time solar production data. To get started, let's delve into the intricacies of these applications and harness the power of real-time solar data interpretation.
Using your App and Interpreting Real-Time Solar Production Data
Once you have access to iSolarCloud and Solar Analytics, you can start to make the most out of your solar system. The home screen from each app is shown below. You can also see a walk through here for Solar Analytics, and here for Sungrow.
The home screen on your dashboard provides an overview of your solar production and energy consumption, as well as your savings. This includes displaying how much energy your solar system is generating, and how much energy your household is consuming in real time.
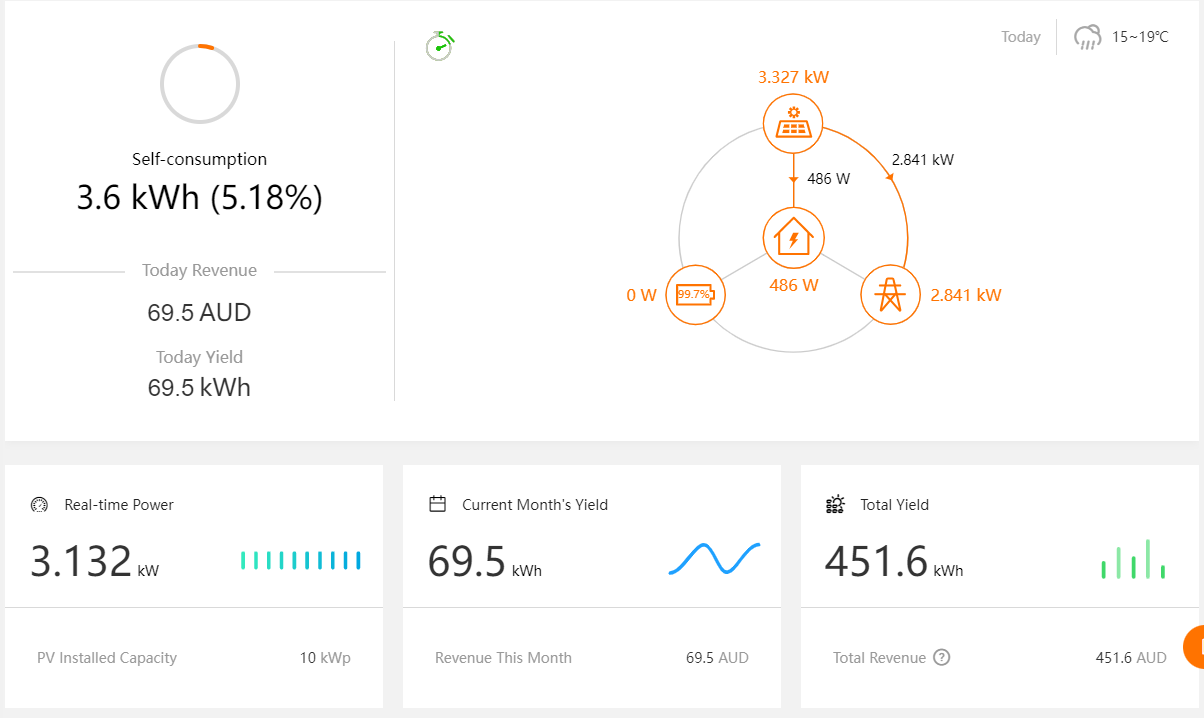

The key thing that most people want to know is “how much of my solar am I using?”. This is because by self consuming your solar you are maximising your savings.
Energy Insights: Analysing Historical Performance and Using Inverter Data to Optimise Energy Consumption
The most popular reasons to access your dashboard are to answer one of the following questions:
- Is my solar system is working properly?
- When is the best time to run my big energy appliances?
- How much has my solar system has saved me this month?
- Why is my recent electricity bill so much higher than usual?
- Should I add a solar battery to reduce my energy bill further?
- Should I shift my off peak hot water to run from my solar during daylight hours?
The Sungrow app provides you with a good energy generation and consumption graph that allows you to calculate and answer some of the above questions (see below). The Solar Analytics app has a number of additional pages and features that will make answering these questions simplicity itself (refer to sample image below).


For more insights into getting more from your solar, read this article.
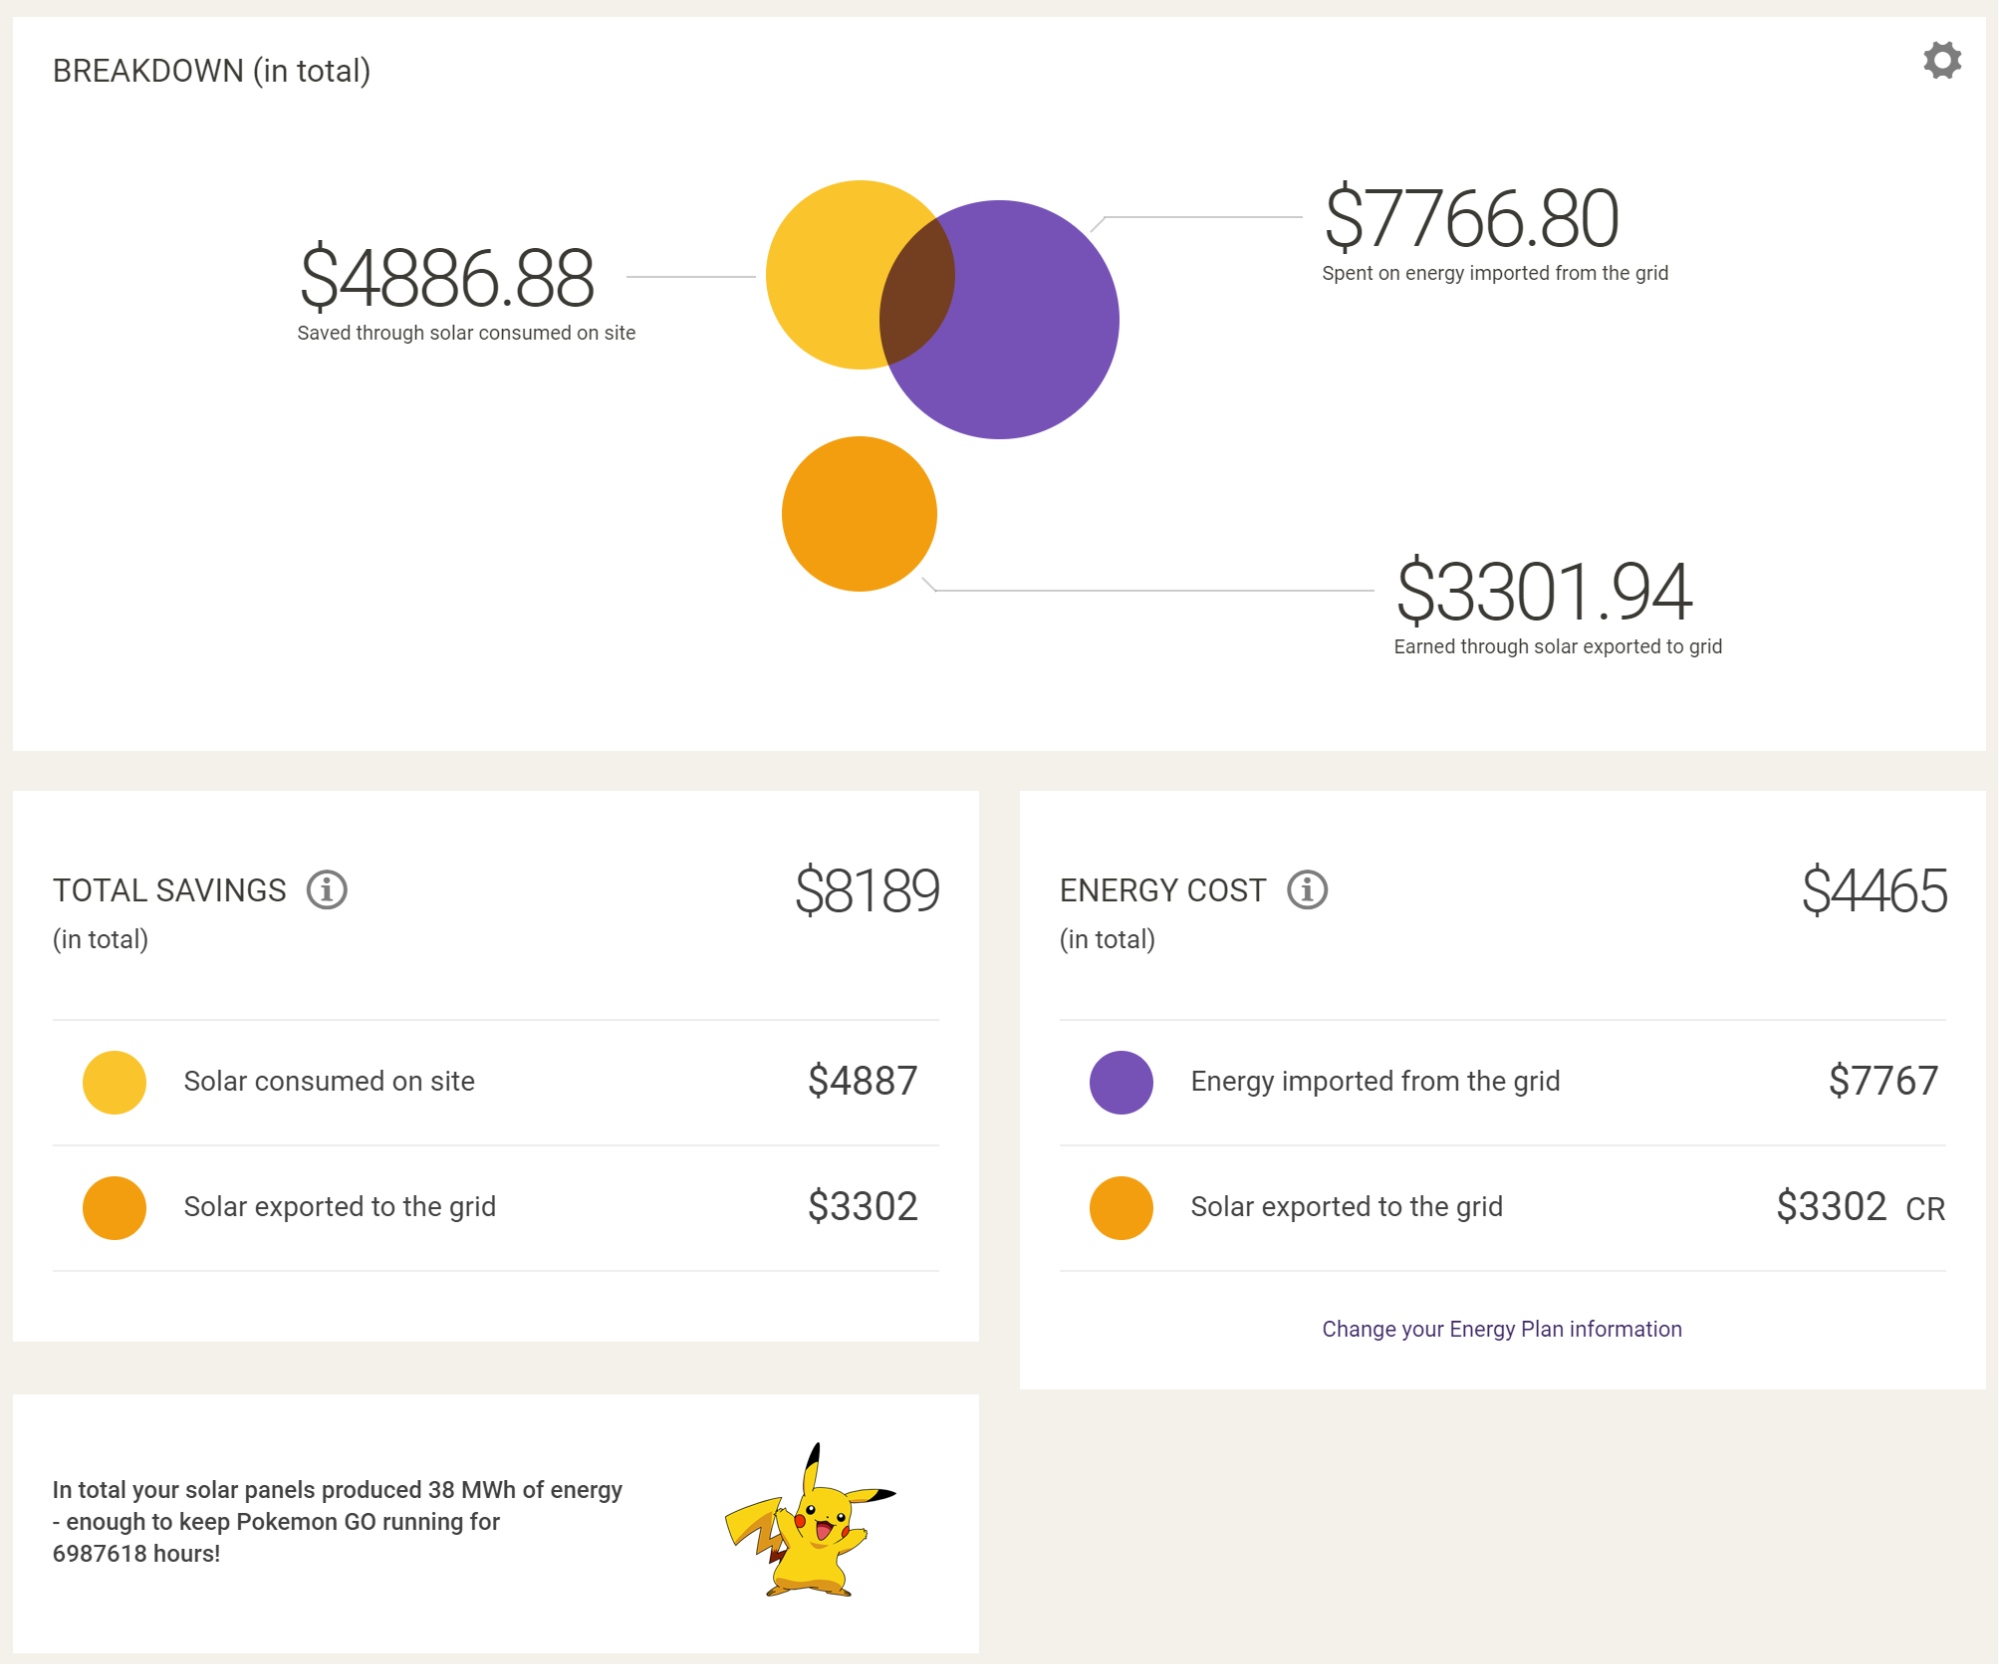
Tracking Your Solar Savings
The main reason most people buy a solar system is to reduce their energy bills. Both iSolarCloud and Solar Analytics show your savings, however Solar Analytics is much more accurate because it includes your specific electricity rates or tariff (and you soon be able to have this information automatically added and updated through open energy CDR, saving you time and providing even more accurate savings and insights).


Monitoring Solar Output and Selecting Your Energy Plan for Peak Performance
Other than self consuming your own solar by using as much energy as possible in the middle of the day, the most important thing you can do to reduce your electricity bill is to select the cheapest electricity plan available. This includes deciding between:
- Flat rate, Time of Use (ToU), Demand, Stepped or other available tariff types
- Flexible or static export limit (Sth Australia only at present)
- Which electricity retailer
- Which electricity plan
The simplest way to do this is to use Plan Optimser from Solar Analytics (see below). Plan Optimiser will compare every energy plan available in your area, and rank them accorinding to cost. Alternatively you can use your iSolarCloud app and energymadeeasy.gov.au to search for the best plan.

Troubleshooting Tips for Sungrow Inverter Readings
If you are unable to see your solar generation and home energy consumption data in your app, or if your energy bill is higher than usual, there are a few potential causes.
- Communications error. Your Sungrow inverter may have disconnected from your WiFi. To remedy this follow these steps.
- No data on Solar Analytics app (but is on iSolarCloud). Either your subscription period with Solar Analytics has ended and you need to resubscribe from your Solar Analytics app, or you need to share your iSolarCloud data – as detailed here.
- Low or zero energy generation. There are many potential causes – inverter fault, grid fault, solar panel fault, DC isolator fault, excessive shading or soiling etc. If your inverter appears to be operating from looking at the Sungrow LCD display, unless you have Solar Analytics you will need your solar retailer or installer to assist with diagnosing and rectifying the issue.
- Clipping. If your solar generation is flat during the middle of the day, this is because you have a fixed export limit, usually 5 kW. In this case you should move some of your energy consumption into the middle of the day to take advantage of this free solar energy.
- Intermittent outage. Even if your solar system is working correctly, you may have periods of time where your inverter either reduces the power output or switches off completely. This can be due to high voltages on the main electricity grid. Solar Analytics can be used to provide your local Distributed Network Service Provider (DNSP) with evidence of this and in many cases they can adjust the local network transformer settings to remedy this issue.
If you have Solar Analytics, then you will already have been sent an email alerting you to the potential issue, and providing you and your solar retailer with detailed guidance on how to rectify any issues.
Refer to the user manual (downloaded from here) for further information on:
- identifying and resolving inverter issues
- reading Sungrow error messages
- understanding diagnostic codes.
If you are having trouble connecting either Sungrow or Solar Analytics, you can contact your solar retailer or https://info.solaranalytics.com/s/owner-knowledge or https://support.Sungrow.com/portal/en/home.
Best practices for maximising the lifespan and effectiveness of Sungrow Solar Inverters
For optimal performance and longevity your Sungrow inverter should be installed in a location that is:
- Well ventilated so that the fan can expel any excess heat
- Does not get exposed to excessive sunlight, especially harsh afternoon sun
- Is at least partially protected from driving rain or snow
While your Sungrow inverter is rated for outdoor installation, like any electronic equipment it will last longer if it is well situated.
You should inspect your Sungrow inverter annual and clear away any build up of leaf material or spider webs from around your inverter.
What are the benefits of choosing Sungrow Solar Inverters over other brands in the market?
Sungrow is the most popular solar inverter currently sold in Australia, with a good local technical support team and a long history in Australia.
The key attributes of a solar inverter are:
- Efficiency – Sungrow models range from 97.7% to 98.6%
- Reliability – provides a ten year warranty
- Suitability – has the appropriate specifications for your specific requirements
- Price – Sungrow provide excellent bang for your buck
They have been independently reviewed by Solar Quotes here.
Frequently Asked Questions
Are there different models or types of Sungrow Solar Inverters available, and how do they compare?
Sungrow has an extensive range of solar inverters. The most appropriate model will depend on your individual needs. Your solar retailer will be able to recommend the best model.
If you don’t have a solar retailer, you can get a quote from validated and reputable solar retailers from Solar Quotes.
Can Sungrow Solar Inverters be integrated with monitoring systems or apps for real-time data access?
Yes. Both iSolarCloud and Solar Analytics offer real time energy insights and monitoring.
Do I need internet connectivity for these monitoring systems?
Yes, both Solar Analytics and Sungrow require a local WiFi connection to provide real-time data and updates. Ensure a stable internet connection for optimal performance. If you don’t have any WiFi connection available, you can get the Classic Solar Analytics solution which uses 4G communications.
What extra value does Solar Analytics add?
On average Solar Analytics will save you an extra $400 every year through:
- Detailed tariff and savings
- Plan optimiser to find the best electricity plan
- Data from your main electricity meter
- More accurate fault identification and alerts
- Battery calculator to know when to get a battery
https://www.solaranalytics.com.au/what-it-does
Can I monitor both my energy production and consumption with Sungrow?
Yes. If you have the Sungrow consumption meter installed, then you will see both solar production and energy consumption. If you don't have a consumption meter installed, then you can use Solar Analytics and CDR open energy to receive your consumption data.
How do I access and view the data collected by the Sungrow monitoring system?
Once your Sungrow inverter is connected to your WiFi, you can login here for easy and convenient operation.
Are there any subscription fees or additional costs associated with Sungrow Consumption Monitoring?
The Sungrow iSolarCloud is free. Solar Analytics costs $6pm or $60pa or $250 for five years for a residential site.
